
Case Study A | Shipping
Problematic
Shipping activity has very recently been suffering the effect of a big green wave of regulations. Starting with MRV Regulation which relates to the CO2 emitted to the atmosphere by each ton of fuel burned by emission sources on board, this fact has become problematic for safety, security and economic reasons since this regulation implicates that companies should pay for emissions beyond their cap.
The Carbon Market is a market-based tool to limit GHG. The Carbon Market trades emissions under cap-and-trade schemes or with credits that pay for or offset GHG reductions.
With the arriving of IMO-DCS, vessel's will have to report in a database fuel consumptions per voyage and annually. Therefore Shipowner's can use tools that help to control these parameters.
Example
Considering a container ship (Vessel A) that makes voyages within EU ports, must report to the authorities each ton of fuel burned by emission sources (main engines, generators, burners), and also the corresponding CO2 ton released to the atmosphere.
The company has the registers of either fuel consumed or CO2 emissions in a certain period of time for a certain year (Year N) which may work as reference values. For Year N the references (average values from all months of Year N) are:
Global HFO Consumption: 233.55 ton
Global Diesel Consumption: 34.44 ton
Emissions (Ton CO2): 837.60 ton
If the company monitor the consumption of fuel for the vessel periodically as a function of time, it could realize in each month of Year N+1, how higher or lower are the consumptions or the emissions. Also, it is well known that some parameters influence fuel consumption, for example, the speed over ground (knots), the cargo carried (ton) or the TRIM of the vessel (meters).
By using a platform such as BOEM, shipowners can monitor each of these parameters among time, evaluate deviations, analyze the causes and take actions on time. This can result in a more efficient comprehension of the vessel, fuel savings and lower emissions to the atmosphere (avoiding sanctions).
Impact
If the vessel monitored the mentioned parameters, on Year N+1 he would realize the following variation relative to the reference values:As we can see there is a considerable variation on each indicator, which could be advised and prevented.
|
|
JAN | FEB | MAR | APRIL | MAY | JUN |
|
Global HFO Consumption (ton) |
302.57 ( 30%) 30%) |
189.30 ( 19%) 19%) |
291.9 (25%) |
329.7 (41%) |
333.2 (43%) |
270.20 ( |
|
Global Diesel Consumption |
39.93 (16%) |
36.30 (5%) |
41.00 (41%) |
37.90 (10%) |
47.2 (37%) |
41.30 ( |
|
Emissions (Tons CO2) |
1070.2 (28%) |
705.8 (16%) |
1040.3 (24%) |
1148.2 (37%) |
1189 (42%) |
973.6 (16%) |
For example, one parameter that influences the consumption is the speed in voyage. Monitoring with BOEM it could be possible for the user to see that the excessive use of speed increased unnecessarily the fuel consumption (comparatively to the reference of Year N-12.66 knots):
| JAN | FEB | MAR | APRIL | MAY | JUN | |
| Speed over Ground (knots) | 10.96 (13%) |
15.00 (18%) |
14.40 (14%) |
14.9 (18%) |
15.00 (18%) |
15.00 (18%) |
Economically this has an impact on the company. Considering the month in with the variation of the consumptions and emissions were higher (May) we could conclude that:
∆ HFOconsumption = 329.7 - 233.55 = 96.15 ton
∆ Dieselconsumption = 47.2 - 34.4 = 12.76 ton
Being the prices of HFO and Diesel at 401.4 €/ton1 and 603.6 €/ton2 respectively, in that month the company could have saved a total of 46296.5€. On the other hand for the same month, less 351.5 ton CO2 could have been emitted which as a considerable environmental impact and cost (16.91 €/ton)3.
1- http://www.bunkerworld.com 2 - https://shipandbunker.com/prices/emea/nwe/nl-rtm-rotterdam#MGO 3 - https://markets.businessinsider.com/commodities/co2-emissionsrecht0
Case Study B | Shipping
Problematic
A general concern among many shipping companies is to quantify how energy efficient their fleet really is. The challenge is to identify the measures ensuring the highest savings potential for the company-specific operational profile, vessel type and business models.
Example
Consider the case of a container ship (Vessel B) that makes voyages within EU ports, so according to new IMO Regulations must report to the authorities each ton of fuel burned by emission sources (main engines, generators, burners, etc), the corresponding CO2 ton released to the atmosphere and also data according to the activity of the ship (Cargo carried, Transport Work, Nautical Miles in voyage, hours at sea). Related to these last indicators are two important KPI’s (Key Performance Indicators), that can give the company an indication of the efficiency of the vessel: Energy Consumption per Nautical Mile (kWh/NM) and Energy Consumption per Cargo (kWH/ton carried). The lower these values are more effective is the vessel.
Consider that the company has the registers of this KPI’s for a certain year (Year N) which may work as reference values. For Year N the references (average values from all months of Year N) are:
Energy Consumption per Cargo: 92.44 kWh/Ton
Energy Consumption per Nautical Mile 666.58 kWh/NM
If a company could monitor periodically the number of miles the vessel makes in each voyage, and their energy consumption (by monitoring each fuel consumption and knowing the NCV (Net Calorific Value) correspondent, it could realize for example in each month of Year N+1, how higher or lower are either the energy consumption indicators. As indicated before they are function of fuel consumption on board, cargo carried and nautical miles made.
By using a platform such as BOEM, shipowner could monitor each of this parameter among time, evaluate deviations, analyse the causes and take actions at proper time. This could result in a more efficient comprehension of the vessel, saving time and money.
Impact
If the vessel monitored the mentioned parameters, on Year N+1 he would realize the following variation relative to the reference values:
|
|
JAN | FEB | MAR | APRIL | MAY | JUN |
|
Energy Consumption per Cargo (kWh/Ton) Reference value: 92.44 kWh/ton |
132.91 (44%) |
88.30 (4%) |
133.50 (44%) |
185.80 (101%) |
126.60 (37%) |
128.00 ( |
|
Energy Consumption per Nautical Mile (kWh/NM) Reference value:666.58 kWh/NM |
583.45 (12%) |
706.30 (6%) |
776.6 (17%) |
714.7 (7%) |
734.3 (10%) |
820.5 ( |
As we can see there is a considerable variation on each KPI, which could be identified and prevented.
For example, one parameter that influences the consumption is the cargo carried. Monitoring with BOEM it could be possible for the user to see that if the vessel is using properly or not its available space. It might be consuming energy inefficiently. Months in which the vessel carries more cargo than it should or months in which it carries very low cargo are the ones in which the KPI shows poorer results. Another parameter could be the nautical miles travelled. By knowing the energy consumed by nautical mile, the company could optimize routes.
| JAN | FEB | MAR | APRIL | MAY | JUN | |
| Cargo Carried (Ton) (Reference: 33517.70 Ton) | 28734.90 (14%) |
12981 (18%) |
36607 (9%) |
37221 (11%) |
56328 (68%) |
33642 (0.37%) |
| Cargo Carried (Ton) (Reference: 33517.70 Ton) | 5421 (26%) |
3446 (20%) |
4630 (8%) |
5318 (24%) |
5662 (32%) |
4453 (4%) |
Economically this has an impact on the company. Considering the month in which the variation of the Energy Consumption per Nautical Mile is higher (June):
∆ Energy consumption per cargo = 820.5 - 666.68 = 153.92 kWh/Nautical Mile
Since in voyage the vessel mainly uses HFO and its prices is 401.4 €/ton (Source: Bunker world), It is possible to establish a correlation between the energy consumed and its cost in Euros.
In June the Vessel performed 4453 miles, where 258.2 ton of HFO were consumed:
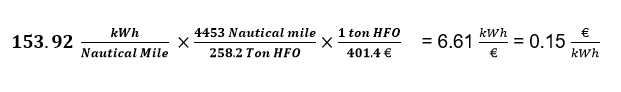
So the company could have saved 0.15 €/kWh.